Dr.Jigme Thinley
Principal Geospatial Consultant,
QTree Pty Ltd
PhD (Geospatial Science/Remote Sensing & AI), Griffith University, Australia.
6/8 Stain Street, Wilston, QLD 4051 (Brisbane)


Geo Application
Rectangular Buffer Tools
In this MSc. in Applied Geoinformatics enabled opportunities for me to apply GIScience concepts in creating readily usable GIS tools. One of such usuable tools was the rectangular buffer script tool created for the ArcGIS 10 software. The tool was implemented using python scripting language, the tool was designed to accept user input including point features and the buffer distance and then compute the rectangular buffer around the point features.
Further substantial documentation was provided to help users of such tools. I have been able to develop small scripts to carry out minor recurring tasks in ArcGIS 10 including scripts to carry out spline interpolation on point features with many fields in the attribute table. ( Click on the image to view for detail information )

Web Services & Online Applcaiton
Tracking of the hotspot destinations in Bhutan
In this class project, OpenLayers, javascript library was used to create an online web application to easily track the toursit centers/destinations in Bhutan.
In the project,Google Maps, Google hybrid, and Street Maps etc were used as a base layers whereas top hotels, parks were added as over-layers. The overlays were introduced as vector layers with clickable popups as can be seen in the left image.

Location Based Services (Collective Sensing)
Europe talks about money
In this class project, a database of twitter data for the continental Europe was analysed with the intention of finding out whether the data could be used to extract all the money related talk and whether this information could then be used to make financial decisions. From 14 million tweet streams, slightly more than 200 thousand tweets referred to money in six different languages; English, German, French, Italian, Spanish, Dutch and Greek. Seven countries in Europe were used for the study, these were United Kingdom (and Northern Ireland), France, Germany, Italy, Netherlands, Spain and Greece. Using GeoTools, Processing (Fry and Reas, 2010) and MapThing (Reades, 2012) libraries in Java, the money related tweets were dynamically mapped for the 29 days in February 2012. According to the study it was observed that most money related talk takes place in major cities with the most significant city being London.
Acknowledgements: I acknowledge the inputs from friends Bartosz Hawelka (PhD. student) & Francis Oloo (MSc. student).
Further details on the entire scope of the project can be found on
http://lbswiners.blogspot.co.at/
References
-
Fry, B., & Reas, C. (2010). Processing. Retrieved July 10, 2012, from Processing: http://processing.org/reference/frameRate_.html
-
Reades, J. (2012). Processing Library MapThing. Retrieved July 10, 2012, from Processing Library MapThing: http://www.reades.com/MapThing/

Application Development for Geo-Browsers
Geobrowsers Application
Applications development for Geo-browsers were introduced to the concepts of web mapping. The first of which was the use of simple HTML tags & Javascript to embed web maps onto websites and blog sites.The figure below shows an example of Google map as embedded on the blog. The basic tools from Google Maps API including zooming (in and out) and navigation were enabled

Location Based Services (Internet of things and Location)
Energy Consumption Management/Monitoring Applicaation
This slides was created for a concept on mobile household energy consumption management mapping. The assignment was carrried out as one of the requirement for the "Location Based Services Couse"(LBS).
Masters Thesis
Thesis : An Application of Object Based Image Analysis for Land Use/Land Cover Change analysis in Thmphu Valley, Bhutan
( Spatial Analysis & Remote Sensing)
ABSTRACT
Rapid land use and land cover change is a major concern in global environmental change, and is specifically significant in rapidly developing regions of the world. With its economic development, population growth and urbanization, Thimphu, the only major city based in the western region of Bhutan, has experienced the dramatic land use and land cover change over the past 21 years(Soil & Centre, 2011)
The objective of this study was to assess land use/land cover change in the landscape of the Thimphu valley area. In order to achieve the objective of this task, different sets of satellite imagery were analyzed. Specifically, Landsat ETM (1990), Landsat ETM+ (2001), Landsat ETM+ (2007), and RapidEye image (2011) were used. Object oriented image analysis (OBIA) method was used to classify all the images. Accuracy assessments were carried for each of the four sets of analysis based on the reference land cover classes published (ICIMOD 2011, http://apps.geoportal.icimod.org)
Statistical analysis was used to tabulate the spatial areas of different land cover classes in the area of study. Five land cover classes were successfully captured in all the years under analysis with overall accuracies ranging from 73.1% to 79% and Kappa value of 62% to 73%. The classification result revealed that bare land (28.18%), forests (70.22%), and snow (1.30 %) were dominant LULC types in revealed that in the year 1990, the dominant land cover classes were bare land, which covered approximately (28% )of the study area, forest which covered approximately (70%) of the study area, and snow which covered approximately (1.3%) of the area of study.
In the year 2011, the bare land covered approximately (47%) of the area of study. The results of change analysis showed that there was a reduction in agriculture cover of 13.5%, 101.1%, and 47.3%, and 20.30% occurred between the first (1990–2001), second (2001–2007), and third (2007–2011, and fourth (1990-2011) study periods, respectively. Similarly, forests cover decreased by 7.6% during the first, 11.2% during the second, and 78.5% during the third and 82.5% during the fourth periods. Snow also declined by 39.2, 27.9, and 75.8% (there was a slight increase in this year) and 22.95 during the three periods, respectively. On the contrary, settlement increased in all four periods by 16.21%, 124.6%, and 77.4%, and 362.96% respectively. Analysis of the 21-year change matrix revealed that about 32% of the land showed changes in the LULC. Further and detail study is suggested to investigate detailed drivers and consequences of changes.
Keywords: Object based image analysis; RapidEye;remote sensing; accuracy assessment; remote sensing; GIS; land use,land cover;Bhutan; Thimphu.

Winter 2011/12 Semester
The following courses were pursued in the winter semester of the academic year 2011/ 2012
-
GIS Project
-
GIScience: Theories and Concepts
-
Cartography and Geovisualization
-
Ontologies and Semantics (Harmonizing Geospatial Information)
-
Design of Geospatial Data Models
-
Distributed GI Architectures
-
Fundamentals and Concepts of Software Engineering
-
Geosimulation
-
Location Based Services
-
Software design for Geoinformatics
-
Remote Sensing
-
Spatial Analysis
-
ESRI VC (ArcGIS 3D Analyst, ArcGIS Spatial Analyst, Cartographic Design)
-
Climate Change Monitoring by means of GIS and Remote Sensing
-
Project Seminar
-
Object based Image Analysis (OBIA)
Summer Semester 2012
In the first semester at the university, I selected courses, the list of which is outlined below.
-
Geo-Applications: Developing of Geoprocessing Applications using Python and ArcGIS
-
Advances Remote Sensing
-
Object Based Image Analysis
-
Geostatistics and Environmental Modeling
-
System Development in Geoinformatics
-
Spatial Data Capture
-
Geosimulation
-
Project Managment
-
Analysis and Modeling
-
Short Intensive Program (International Summer School GIS)
-
Web Mapping and Online Application
-
Location Based Services/ Collective Sensing
-
GIS Tools for Landscape Analysis and Modeling
-
GIScience concepts for decision-making and integrated land use modeling
-
Decision-making tools and integrated spatial modeling

Analysis and Modelling
Water Evaluation and Planning (WEAP) tool for water resource management
This presentation was made as a seminar presentation which was part of the "Analysis and Modelling" seminar course for the Msc Applied GeoInformatics course at the University of Salzburg
The full report for the student task can be found in the link below: Click here
GIScience : “Do Technology trends in Geo-informatics influence scientific questions – or vice versa?”.
Introduction
The trend of technology has effected Geoinformaticis significantly. However growing technology has resulted growing in Geoinformatics and the demands of new and more accrued methods in Geoinformatic resulted to progress in technology. (Dadhwal and Raju 2010). For example, in the field of Remote Sensing, the availability of satellite imagery at very high spatial resolution (sub meter) has led to a shift in the procedure of image analysis from the classical pixel-based image analysis to Object Based Image Analysis.
And similarly with more research in the area of Object Based Image Analysis, new tools are being created that can take advantage of the expert knowledge and harness the same into rule sets which can then be used (and reused) to carry out image analysis. This is opposed to the to the classical image analysis that was carried out in classical remote sensing software including IDRISI, ERDAS and ENVI. However, Geoinformatics also has feedback with new methods for image processing such as Object Based Image Analysis. It wasn’t limited only for remote sensing.
Technology: Geospatial technologies have found viable applications in virtually all areas of human activity. In research, they are now essential to any discipline that deals with phenomena on or near the surface of the Earth, from atmospheric science to criminology.
Research Question: "It is a question which should address a scientific problem that is not yet solved and where there is confidence that general truths remain to be discovered”.Goodchild (2010).
The presentation that was made on this topic is embedded herein.
The full paper can be found in the link below:
Cartography & Geovisualization
Landscape Visualisation and Wind Farm Assessment Analysing Visual Impacts with Google Earth
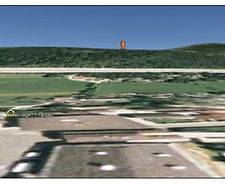
This project aims to build a 3D model of a current wind farm porposal in Google Earth and assess the likely visual impact from key points around the landscape. The work focussess on the Kolowind wind farm proposal on Kolomansberg, in the state of Salzburg.
The wind farm proposal features three turbines witha maximum height to blade tip of 149.8m. The visial impact of this development on the surrounding landscape is one of the key points made by gropus in opposition to the proposal and will be explored in this project.
Acknowledgements: I acknowledge the inputs from friends Sebastian Cadus & Marius Hermann.
The full paper can be found in the link below:

Spatial Data Acquisition
Orthorectification of Gaisberg of Salzburg, Austria
The overall focus of this project was to cover the following objectives.
-
Identification of Ground Control Points (GCP) in the aerial pictures (overlapping areas) and to collect their coordinates from the field
-
Orthorectification of aerial photos
-
Creating digital surface model
-
& Mosaic the images
The comprehensive technical report of Orthorectification can be found in the link below: